What Percentage of Internet Traffic Is Mobile?
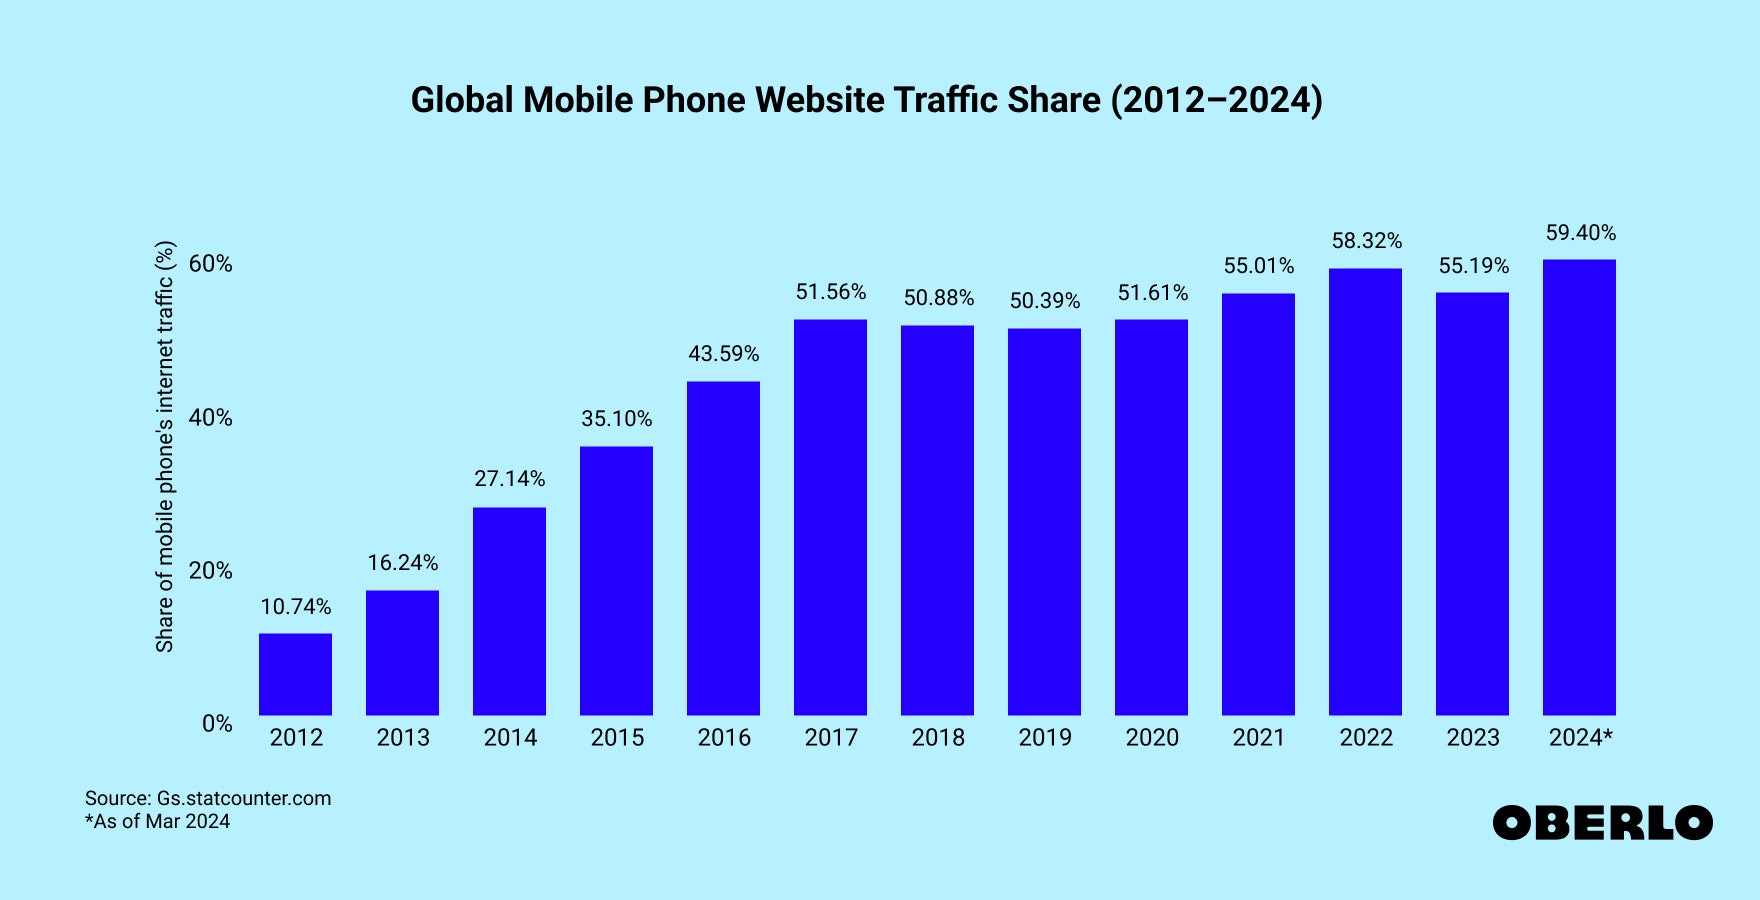
The percentage of global web traffic on mobile phones has surged over the past decade. As of March 2024, 59.4% of all web traffic came through mobile phones.
If we were to go back to 2012, this figure was at a meager 10.74%. Fast forward five years later to 2017, and the percentage of web traffic on mobile had already increased five-fold to 51.56%.
The quickest growth rate came from the first few years of the past decade and has slowed significantly since then. Here’s a closer look at some key mobile vs. desktop internet usage statistics over the past few years.


Global mobile vs. desktop internet usage (2012–2024)
|
Year |
Percentage of global web traffic on mobile |
Percentage of global web traffic on desktop |
Percentage of global web traffic on tablet |
|---|---|---|---|
|
2012 |
10.74% |
87.96% |
1.31% |
|
2013 |
16.24% |
79.18% |
4.59% |
|
2014 |
27.14% |
66.57% |
6.29% |
|
2015 |
35.10% |
59.17% |
5.73% |
|
2016 |
43.59% |
51.37% |
5.04% |
|
2017 |
51.56% |
43.75% |
4.69% |
|
2018 |
50.88% |
45.11% |
4.02% |
|
2019 |
50.39% |
46.04% |
3.57% |
|
2020 |
51.61% |
45.64% |
2.75% |
|
2021 |
55.01% |
42.31% |
2.69% |
|
2022 |
58.32% |
39.43% |
2.25% |
|
2023 |
55.19% |
42.88% |
1.94% |
|
2024 (as of Mar 2024) |
59.40% |
38.49% |
2.11% |
For some to win, others must lose. The rise in the percentage of web traffic on mobile has had an immense impact on desktop web traffic.
In 2012, a large majority of all web traffic came through desktops (87.96%). The very first time the percentage of web traffic on mobile exceeded that of desktop came in November 2016, when 50.7% of overall internet traffic came from mobile phones, just a little more than desktop at 49.3%.
→ Click Here to Launch Your Online Business with Shopify
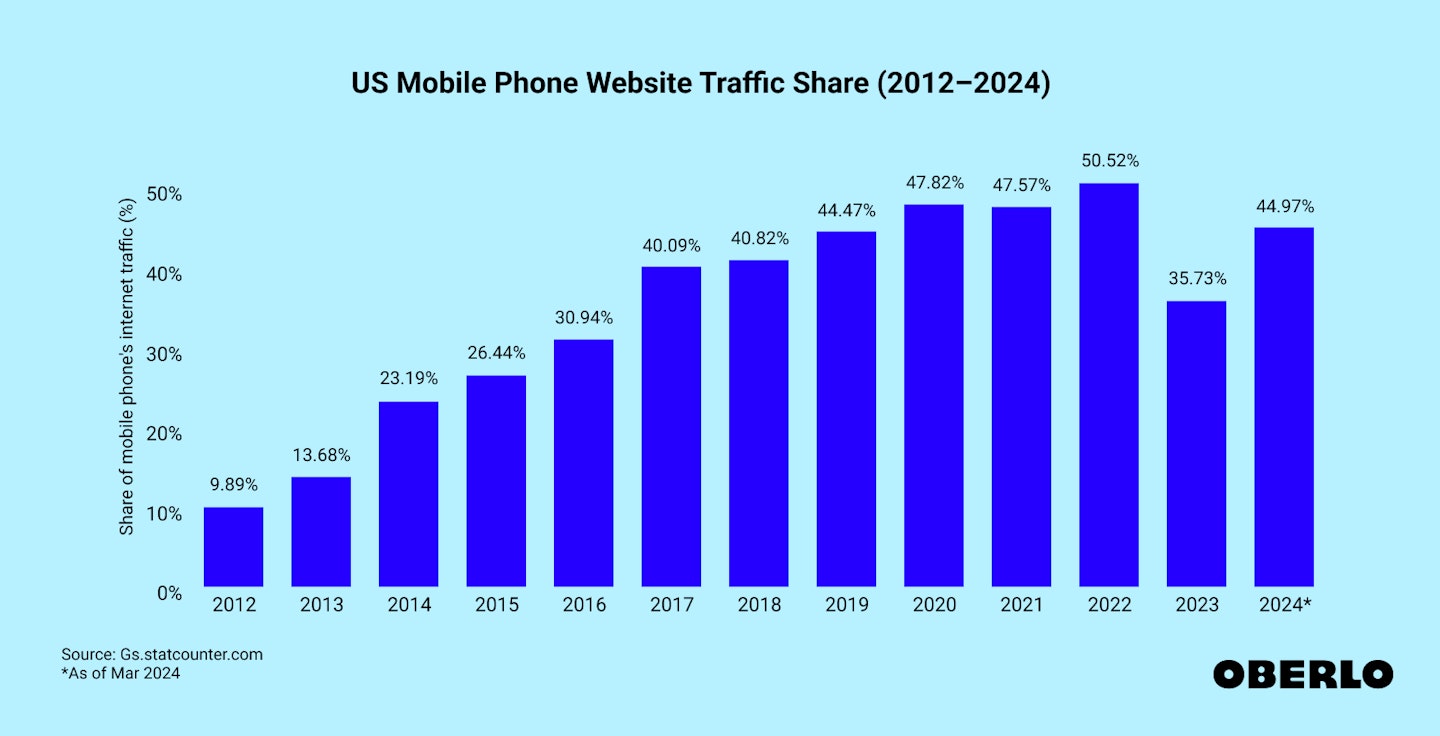
Mobile browsing stats in the United States (2012–2024)
|
Year |
Percentage of US web traffic on mobile |
Percentage of US web traffic on desktop |
Percentage of US web traffic on tablet |
|---|---|---|---|
|
2012 |
9.89% |
88.04% |
2.07% |
|
2013 |
13.68% |
79.79% |
6.53% |
|
2014 |
23.19% |
67.89% |
8.93% |
|
2015 |
26.44% |
64.67% |
8.89% |
|
2016 |
30.94% |
60.61% |
8.44% |
|
2017 |
40.09% |
51.10% |
8.80% |
|
2018 |
40.82% |
51.20% |
7.97% |
|
2019 |
44.47% |
48.45% |
7.08% |
|
2020 |
47.82% |
47.84% |
4.34% |
|
2021 |
47.57% |
48.88% |
3.56% |
|
2022 |
50.52% |
46.43% |
3.05% |
|
2023 |
35.73% |
62.21% |
2.07% |
|
2024 (as of Mar 2024) |
44.97% |
52.27% |
2.76% |
The distribution of mobile vs. desktop internet usage in the United States looks very different. While statistics show that slightly more global consumers prefer to browse on their mobile phones than desktops, US consumers appear to favor desktops more. As of March 2024, 44.97% of the total web visits are currently mobile, compared to 52.27% coming from desktops.
From 2020 to 2023, mobile and desktops traded positions every year with just a few percentage points separating their corresponding market shares. But in 2023, desktops pulled ahead, registering a market share of 62.21%, 26.48 percentage points higher tha mobile’s.
US mobile browsing stats: consumers’ favorite browsers
Of the mobile internet browsers, Apple’s Safari is proving to be the most popular choice among all mobile internet users in the US. The latest figures show that 52.88% of all US mobile users use Safari to browse the internet, with Google Chrome coming in second with 40.49%.
These mobile browsing stats should come as no surprise, given that iPhones are popular in the US and Safari is pre-installed on all iPhone devices. As it stands, there are approximately 136 million iPhone users in the US.
→ Click Here to Launch Your Online Business with Shopify
Want to learn more?